Ошибка формата электронной почты
emailCannotEmpty
emailDoesExist
pwdLetterLimtTip
inconsistentPwd
pwdLetterLimtTip
inconsistentPwd

Offer Technical Support and Customized Solutions
The company is committed to creating new and improved plastic materials to meet the evolving demands of the market.

Thermoplastic Elastomers: Causes of Testing Deviation and Shore A to Shore D Conversion
Relative to other plastics, hardness is a more critical indicator for thermoplastic elastomers. Although hardness testing is relatively simple, various testing conditions and methods can lead to deviations in hardness values. The following details the testing methods for hardness and the reasons for deviations:
1.Introduction to Thermoplastic Elastomer Hardness Testing StandardsCurrently, the main testing standards include ISO 7619, ASTM D2240, and ISO 868. Among these, ISO 868 specifies the testing of Shore A or Shore D hardness for plastics and hard rubber. ISO 7619 Part 1 describe the testing of Shore A, Shore D, Shore AO, and Shore AM hardness for vulcanized rubber and thermoplastic rubber (i.e., thermoplastic elastomers). It specifies:
Shore A: Standard hardness, Shore D is selected when hardness is above 90A.
Shore D: High hardness, Shore A is selected when hardness is below 20D.
Shore AO: Low hardness rubber and sponge, Shore A is selected when hardness is below 20.
Shore AM: Thin sheet specimens, selected when the total thickness of the specimen is less than 6mm.
ISO 7619 Part 2 describe the portable rubber international hardness tester for vulcanized rubber and thermoplastic rubber (i.e., thermoplastic elastomers). International Rubber Hardness is abbreviated as IRHD.
| ISO 7619 | ISO 868 | |
| Sample thickness | at least 6mm at least 2mm per piece |
at least 4mm |
| Indentation speed | 3.2mm/s | |
| Applied weight | A :1 kgs D :5 kgs |
|
| Distance from edge | at least 12mm | at least 9mm |
| Test plane radius | at least 6mm | at least 6mm |
| Distance between different test points | at least 6mm | at least 6mm |
| Dwell time | 1~15 Seconds | 1~15 Seconds |
3.Causes of Deviation in Thermoplastic Elastomer Hardness Testing
3.1. Sample Processing Methods
Samples (test rods) can be processed by injection molding, extrusion, calendaring, or compression molding. Typically, injection-molded samples will have a hardness 2-4A higher than other samples.
3.2. Ambient Testing Temperature
The standard temperature is 23°C. Comparatively, in winter at 0°C and in summer at 30°C, the test results in summer are generally 2-5A lower than in winter. Even if stored under conditions of 23°C for 1 hour, there is still a deviation of 1-3A between winter and summer.
3.3. Reading Time during Testing
Typically, the reading is taken 1 second after the hardness tester makes steady contact with the sample surface. The reading is highest at this point and decreases to its minimum after 15 seconds, with a difference of approximately 2-6A between them.
3.4. Applied Weight (Force) during Testing
When using a fixed support during testing, a fixed weight of masses can be added, maintaining a constant force. However, if a handheld hardness tester is used, the force applied to the sample surface varies among individuals, resulting in a deviation of roughly 2-5A, especially for softer hardness.
3.5. Contact Speed between Hardness Tester and Sample Surface during Testing
Excessive or insufficient force applied during testing can lead to hardness deviations, resulting in a deviation of approximately 1-2A.
4.Conversion between Different Hardness ScalesIt's generally not recommended to convert between Shore D, Shore A, and International Rubber Hardness (IRHD). However, for communication or estimation purposes, here are some recommended methods:
4.1. Conversion Formula
A = 0.173D + 86.58
For example, how to convert Shore D38 to Shore A? Shore A = 0.173 × 38 + 86.58 = 93.154.
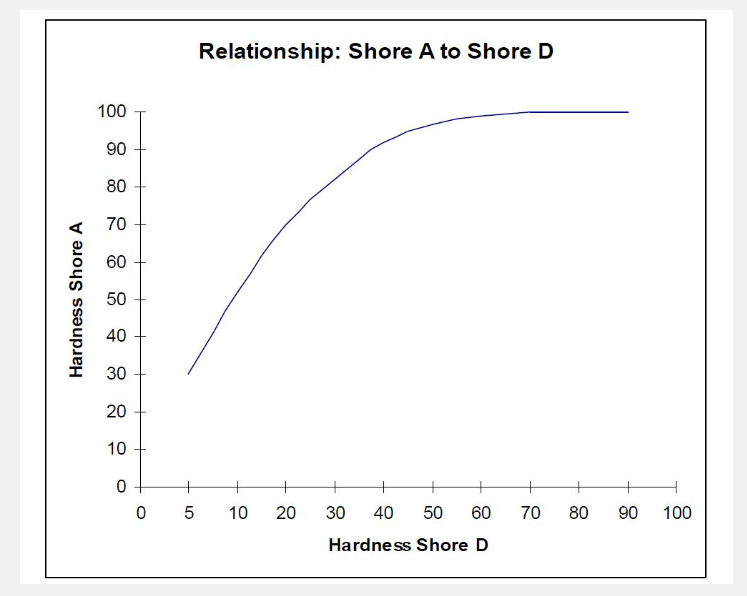
4.2 Conversion Coordinate Chart

From this chart, Shore A90 is approximately equal to Shore D38, which contradicts the conversion formula in 4.1. This also indicates that the conversion between Shore A and Shore D is not a simple linear relationship. The conversion relationship between Shore A and Shore D actually depends on the resilience properties of the thermoplastic elastomer being tested.
4.3. Conversion Chart
| Shore A | 33 | 38 | 42 | 45 | 49 | 52 | 55 | 57 |
| Shore D | 10 | 11 | 12 | 13 | 14 | 15 | 16 | 17 |
| Shore A | 60 | 62 | 64 | 66 | 68 | 70 | 72 | 73 |
| Shore D | 18 | 19 | 20 | 21 | 22 | 23 | 24 | 25 |
| Shore A | 75 | 76 | 77 | 79 | 80 | 81 | 82 | 83 |
| Shore D | 26 | 27 | 28 | 29 | 30 | 31 | 32 | 33 |
| Shore A | 84 | 85 | 86 | 87 | 88 | 88 | 89 | 90 |
| Shore D | 34 | 35 | 36 | 37 | 38 | 39 | 40 | 41 |
| Shore A | 91 | 91 | 92 | 92 | 93 | 94 | 94 | 95 |
| Shore D | 42 | 43 | 44 | 45 | 46 | 47 | 48 | 49 |
| Shore A | 95 | 96 | 96 | 97 | 97 | 97 | 98 | 98 |
| Shore D | 50 | 51 | 52 | 53 | 54 | 55 | 56 | 57 |
| Shore A | 98 | 99 | 99 | 99 | 100 | 100 | 100 | 100 |
| Shore D | 58 | 58 | 59 | 60 | 61 | 62 | 63 | 64 |
| Shore A | 100 | 100 | 100 | 100 | 100 | 100 | 100 | 100 |
| Shore D | 65 | 66 | 67 | 68 | 69 | 70 | 73 | 75 |

